I'm Joel. I built CandleDojo. There are thousands of resources that teach you what a hammer candlestick looks like. Almost none of them make you practice spotting one on a real chart. Reading price action is a visual skill. You don't learn it from diagrams or YouTube breakdowns. You learn it the way you learn to read sheet music or spot fractures on an X-ray - through reps with real data. CandleDojo gives you a real historical chart, you call the direction, and the chart plays forward so you see what actually happened. It tracks your accuracy, streaks, and progression across multiple markets. Think Duolingo, but for chart reading. It's free, I'm building it based on real feedback from traders, and I'm still early. If you've ever felt like you "know" candlestick patterns but freeze when you see a live chart, this is what I made it for. Curious to hear - how did you actually get good at reading charts? Was it screen time, courses, something else? candledojo.app/play
CandleDojo
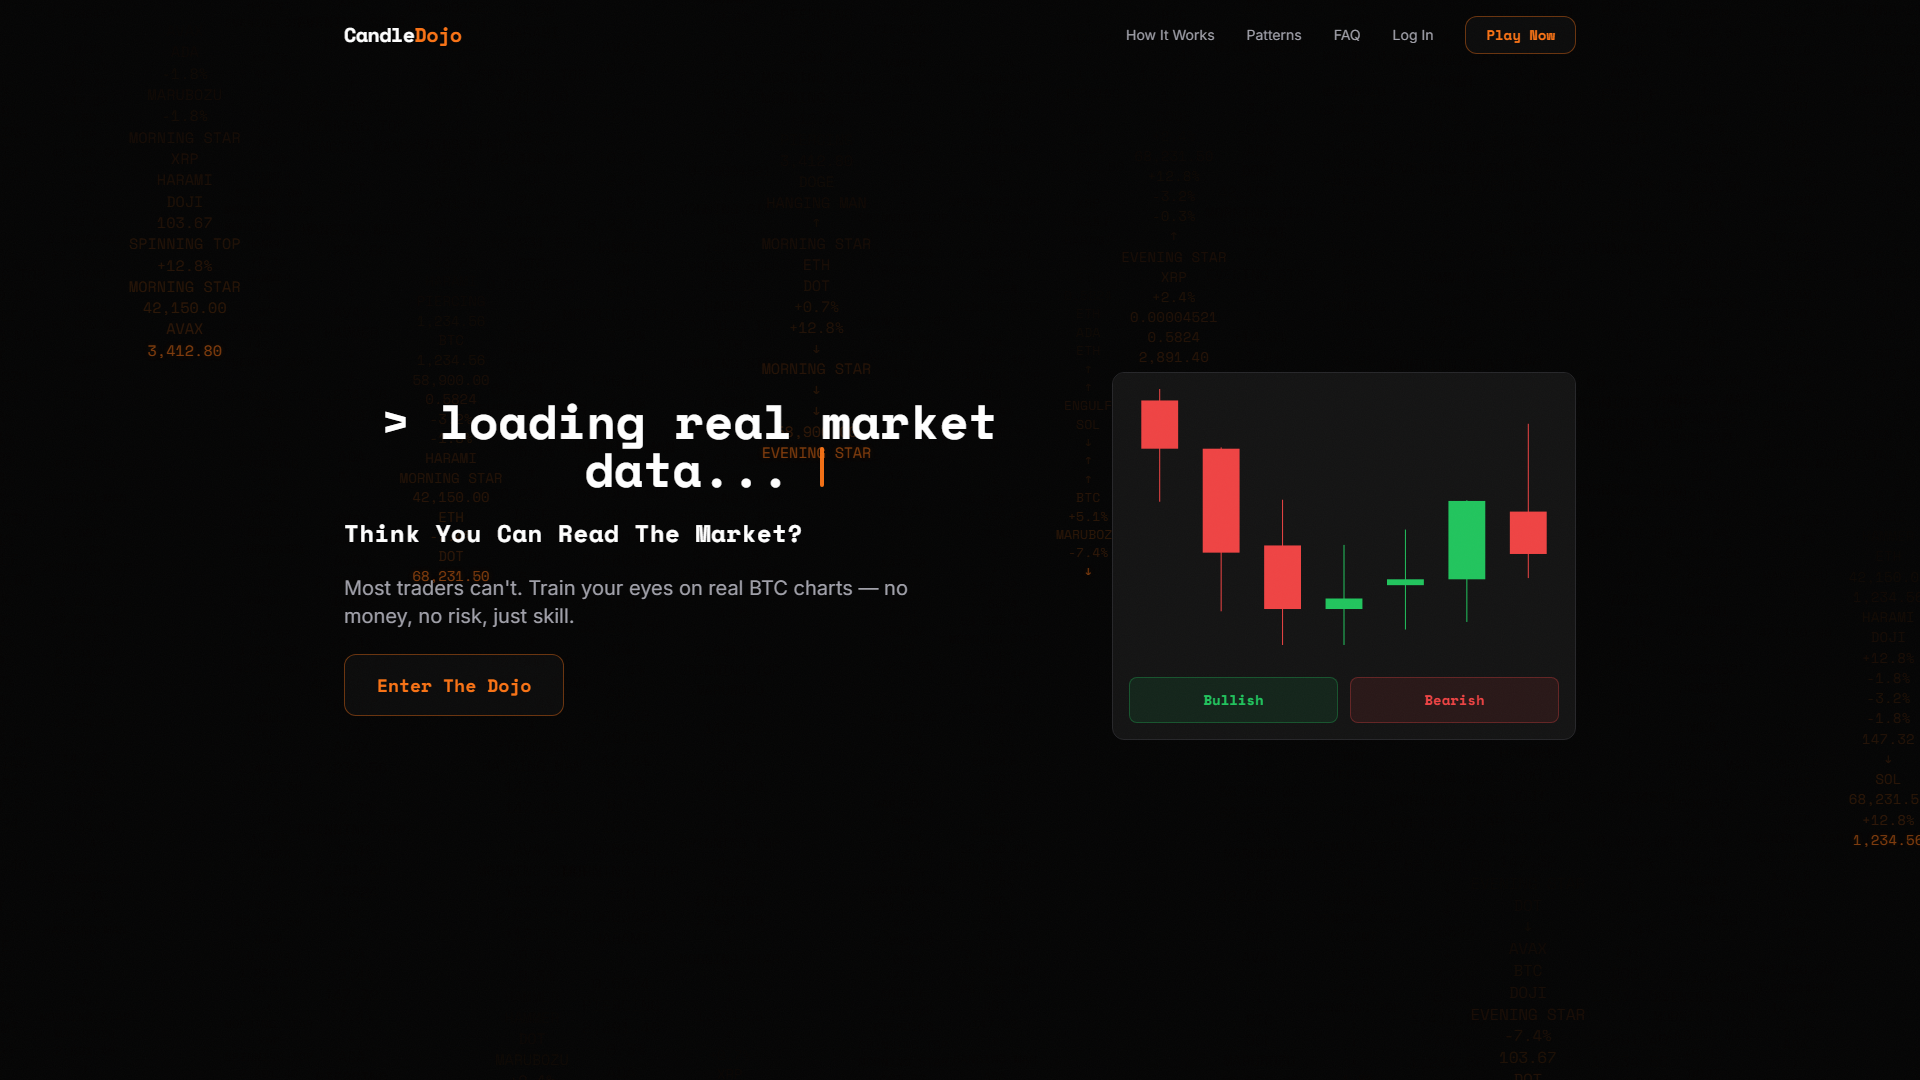
Master chart reading with real market data, no risk involved.
About
CandleDojo is your ultimate training ground for mastering chart reading skills. Designed for aspiring traders, this free platform offers real market data across 13 different markets, allowing you to practice without the risk of losing money. Whether you're a beginner or looking to refine your skills, CandleDojo provides an engaging environment to hone your abilities. Enter the dojo and start analyzing actual BTC price movements with no sign-up required. With features like instant feedback on your calls—bullish or bearish—and a comprehensive pattern library that includes Doji, Hammer, and Engulfing patterns, you can track your accuracy and unlock new trading strategies. Progress through various difficulty modes to challenge yourself and improve over time. Join countless other traders who are sharpening their skills at CandleDojo and prepare to read the market like a pro!